What Does a Car Really Cost?
How much is that car really costing? You? The rest of us? (World Streets, May 24, 2010)
Also discussed here: Transportation Cost and Benefit Analysis Techniques, Estimates and Implications (500 page pdf in sections, Victoria Transport Policy Institute, Jan.2, 2009)
And here: Transportation Cost Analysis Spreadsheet (Excel spreadsheet, Victoria Transport Policy Institute, Jan.2, 2009)
And here: External Costs of Transport in the U.S. (34 page pdf, Forthcoming in Handbook of Transport Economics, ed. by A. de Palma, R. Lindsey, E. Quinet, and R. Vickerman, Edward Elgar Publishing Ltd. 2010)
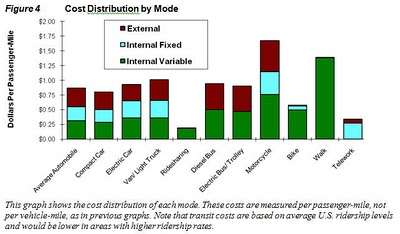
When asked how much their car costs, many drivers think first of the cost to operate it( fuel mainly), or maybe also the cost of owning it which includes depreciation, insurance, licensing etc. Few consider what it costs to the city in terms of infrastructure (road maintenance and building)or the costs to public health because of worsened air quality, as a result of traffic congestion and vehicle emissions, the focus of this blog. To turn the question around, what would be saved for each car taken off the road and replaced by another modal option. The article reviewed today looks at these issues. Among some myth-breaking insights is the higher costs of driving at rush hour vs. off peak or the relative insignificant savings of electric cars or the 70% higher costs of urban (peak) driving vs. rural driving.
The City of Ottawa recently looked at what each mode costs the city in terms of services provided- in terms of service per passenger trip in this report: Costs For Different Transportation Modes (City of Ottawa Transportation Committee, Feb. 1, 2010)
“The total public (government and societal) cost per passenger trip, including construction, maintenance, land value, enforcement, unaccounted accidents, air, noise and water pollution are: Car driver: $2.50, Transit user: $1.76, Cyclist: $0.24, Pedestrian: $0.10”.
Translating these costs to a cost per mile (or km) was not attempted in the report but would likely lower the difference between modes as shown in the review article because car commuters typically travel 5 times farther than cyclists (25 km trip vs. 5 km say)who in turn would typically travel as much more than pedestrians (5 km trip vs. 1 km).
Using these “typical” figures results in a cost of about 10 cents per km for all three modes. Again though, the City included only the external costs to the city and did not include operating or ownership costs nor the impact on the environment.
Key Quotes:
“lists the 23 categories of transport costs considered in my analysis. Some costs, such as parking and accidents, are divided into internal costs, which are borne directly by users, and external costs, borne by other people.”
“public transit travel costs are much lower than automobile costs under urban-peak conditions, and under favorable conditions walking and cycling can have very low costs”
“what it costs to drive they typically mention vehicle operating expenses, which average approximately 16¢ per mile for a typical automobile. Some may include vehicle ownership costs, which average about 27¢ per mile… Total estimated costs range from about $0.94 per vehicle mile for rural driving to $1.64 for urban-peak driving.”
From 'Pollution Free Cities': pollutionfree.wordpress.com


What so expensive about a car is not only its price, but the maintanance cost. Better take public transport.
ReplyDelete